

What is Proteomics? A guide to Mass Spectrometry, Search Engines, and Data Acquisition
What is proteomics?
Proteomics is the large-scale study of all proteins expressed by a cell, tissue, or organism at a given point in time.
While genomics tells you which genes an organism has, and transcriptomics tells you which are being transcribed, proteomics tells you what is actually being made — and in what quantities. Proteins are the molecular machines that carry out almost every biological function: they catalyze reactions, transmit signals, build structures, and defend against pathogens. Understanding which proteins are present, how abundant they are, and how they change across conditions is central to understanding biology and disease.
The proteome is far more complex than the genome. A single gene can give rise to dozens of protein variants through alternative splicing and post-translational modifications (PTMs) like phosphorylation, glycosylation, and ubiquitination. A human cell may express tens of thousands of distinct protein species simultaneously, spanning many orders of magnitude in abundance — from abundant structural proteins to rare transcription factors present in just a few copies per cell.
Why proteomics matters clinically: Proteins are the targets of the vast majority of approved drugs. Proteomic profiling can reveal disease biomarkers, drug targets, and mechanisms of resistance that are invisible at the genomic level — because many disease-relevant changes happen after the gene is transcribed.
Proteomics vs genomics vs transcriptomics
These three fields are complementary, not competing. Genomics gives you the blueprint; transcriptomics shows which genes are currently active; proteomics shows what is actually being built and used. For drug development and biomarker discovery, proteomics is often the most directly informative layer because it measures the molecules that drugs actually interact with.
How mass spectrometry works in proteomics
Mass spectrometry (MS) is the dominant technology for proteomics — it can identify and quantify thousands of proteins from a single sample in hours.
A typical proteomics workflow begins by extracting proteins from a biological sample and digesting them into smaller fragments called peptides using an enzyme like trypsin. These peptides are then separated by liquid chromatography (LC) based on their chemical properties, and the resulting fractions are injected into a mass spectrometer.
Inside the mass spectrometer, peptides are ionized and their mass-to-charge ratios (m/z) are measured with high precision. In a tandem mass spectrometry (MS/MS) experiment, individual peptide ions are then selected and fragmented — broken into smaller pieces — and the masses of those fragments are measured in a second round. This fragmentation pattern acts as a fingerprint: by comparing it against theoretical fragmentation patterns generated from known protein sequences, a search engine can identify which peptide produced the spectrum.
Key instruments in modern proteomics
The most widely used instruments are Orbitrap-based mass spectrometers (from Thermo Fisher Scientific), which offer very high mass accuracy and resolution. Bruker timsTOF instruments add an additional separation dimension called ion mobility. Both platforms generate the raw data files (.raw, .d, .mzML) that proteomics search engines process.
The data challenge: A single proteomics experiment can generate millions of MS/MS spectra. Each one needs to be matched to the right peptide sequence — a computational problem that requires sophisticated algorithms and, increasingly, machine learning.
What is a proteomics search engine?
A proteomics search engine is the software that interprets raw mass spectrometry data — matching fragmentation spectra to peptide sequences from a protein database.
When a mass spectrometer generates a fragmentation spectrum, it is essentially a bar chart of fragment masses. The search engine's job is to figure out which peptide produced that pattern. It does this by comparing the observed spectrum against theoretical spectra predicted for every candidate peptide in a database (typically a FASTA file of known protein sequences for the organism being studied).
Classical search engines — MaxQuant, MSFragger, Comet, Proteome Discoverer — score each match by counting how many of the expected fragment ions (b-ions and y-ions) appear in the observed spectrum. This works, but it discards substantial information: the relative intensities of those peaks, the presence of ions outside the textbook series, and the broader spectral context.
How modern search engines differ
More recent tools improved on this by incorporating predicted fragment intensities and retention times, feeding dozens of engineered features into a second-stage classifier trained separately for each dataset. These approaches — including MSBooster, MS²Rescore, Prosit, and CHIMERYS — identify more peptides than classical engines at the same false discovery rate.
Tesorai Search takes a different approach: a single deep learning model reads the entire spectrum alongside the candidate peptide sequence and outputs one score — no hand-crafted features, no per-dataset retraining. Because the model is trained once on 289 million peptide-spectrum matches and never retrained on the data being analyzed, it avoids the overfitting risk that comes with on-the-fly classifier training.
DDA vs DIA: What’s the difference?
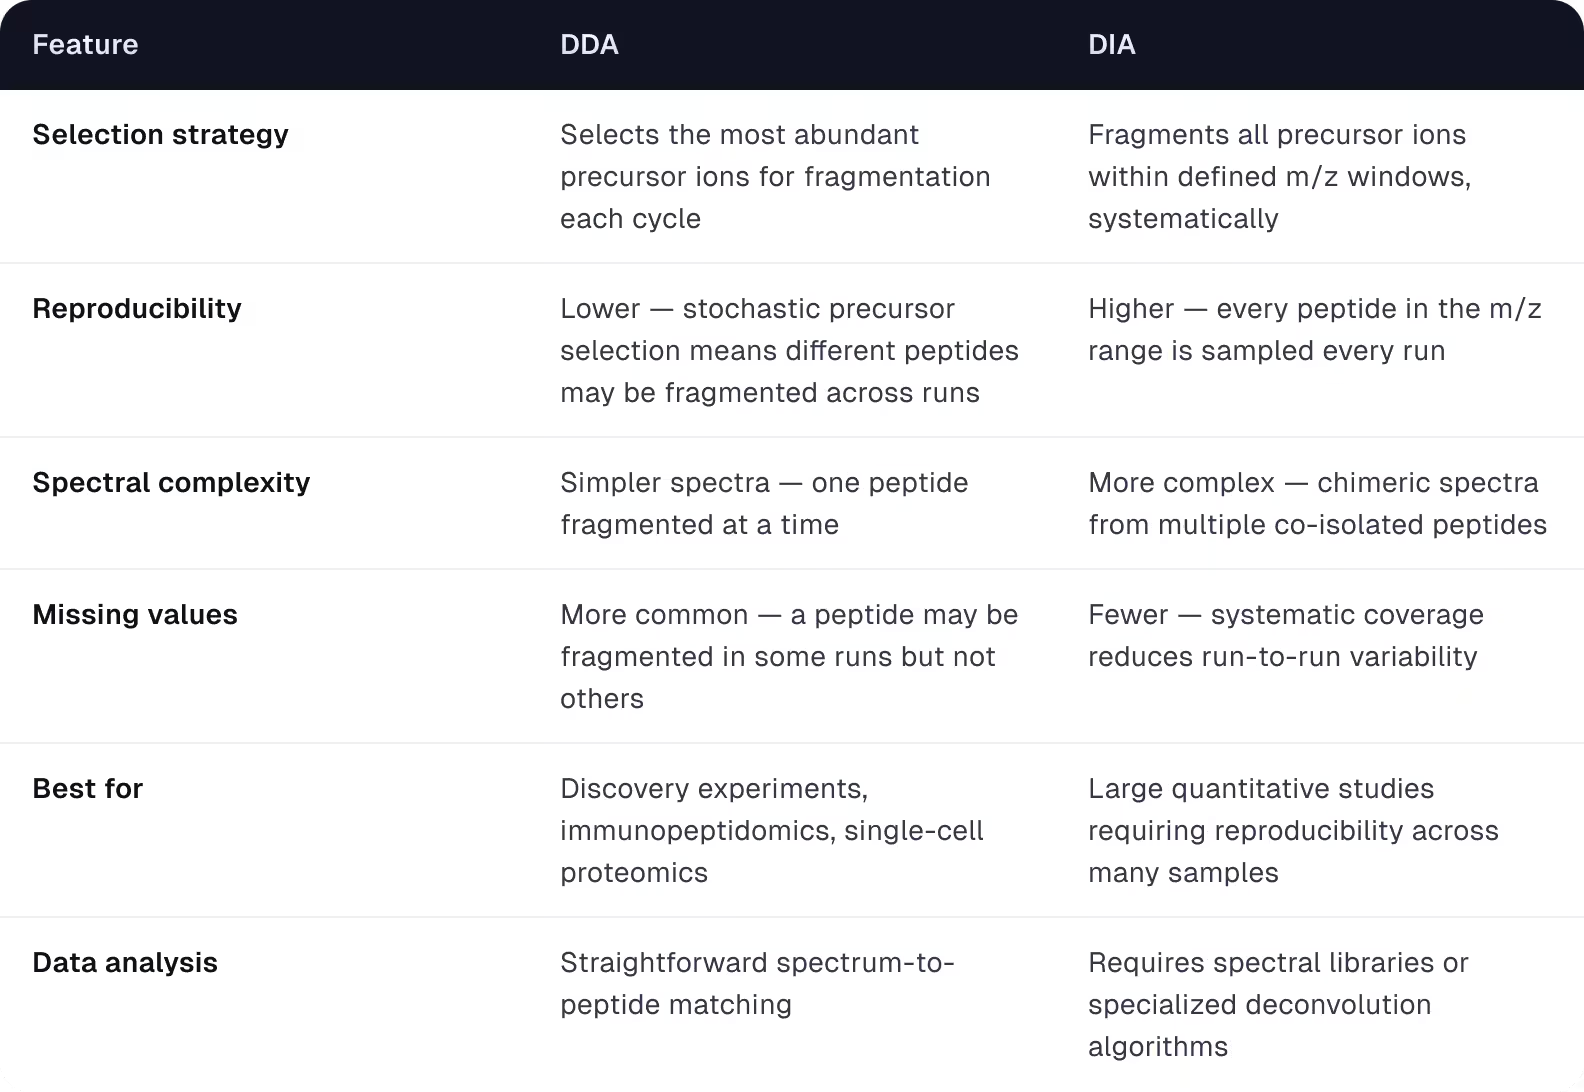
Data-dependent acquisition (DDA) and data-independent acquisition (DIA) are the two main strategies for selecting which peptide ions to fragment during a proteomics experiment. They involve different trade-offs between coverage, reproducibility, and data complexity.
Which should you use?
DDA remains the dominant approach for discovery proteomics, immunopeptidomics, and experiments with limited sample amounts (such as single-cell proteomics). DIA is increasingly favored for large-cohort studies where reproducible quantification across hundreds of samples matters more than maximal depth per run.
Tesorai Search currently supports both DDA and DIA workflows including tryptic digests, immunopeptidomics, and single-cell analyses — across Orbitrap and timsTOF instruments, with or without isobaric labeling (TMT/iTRAQ).
Why analysis quality matters as much as instrument quality
The same raw data can yield very different biological conclusions depending on which search engine analyzes it — and how well that engine controls its error rate.
Modern mass spectrometers are capable of generating rich, information-dense spectra. But that information is only as useful as the algorithm that interprets it. A search engine that misses 20% of real peptide identifications — or incorrectly reports identifications that aren't real — directly limits the biological conclusions you can draw, the biomarkers you can detect, and the proteins you can quantify.
The gap between search engines is substantial and well-documented. In independent benchmarks, the difference between the best and worst tools spans 30–50% in peptide identification depth at the same stated error rate. For a typical proteomics experiment, that means thousands of additional peptides — and the proteins they represent — either found or missed, based purely on which software you use.
The key question to ask of any search engine: Does it report more identifications because it is genuinely better at reading spectra — or because it is loosening its error threshold, using match-between-runs transfers, or overfitting to each dataset? These are different claims, and they require different evidence.
See how Tesorai Search compares
Explore more resources


Publications
Tesorai Search: Cloud-based Database Search Engine Boosts Identifications for Mass Spectrometry Proteomics With a Pretrained Peptide-spectrum Deep-learning Model
Tesorai Search is now peer-reviewed and published in the Journal of Molecular Biology, detailing the model's design and benchmarking against other leading proteomics search engines.
.svg)