Tesorai Chat
Talk to your data.
Get real analysis back.
Tesorai Chat puts advanced bioinformatics at your fingertips.
No pipelines, no coding, just answers.


See It In action
Ask a question. Get back a real analysis.
Every example below is a real prompt.
No pipelines, no scripts, just plain English.
Quality Control
Spot batch effects and outliers before they skew your analysis.
Check this dataset for batch effects and sample outliers before I start differential expression analysis.
Interactive Volcano Plots
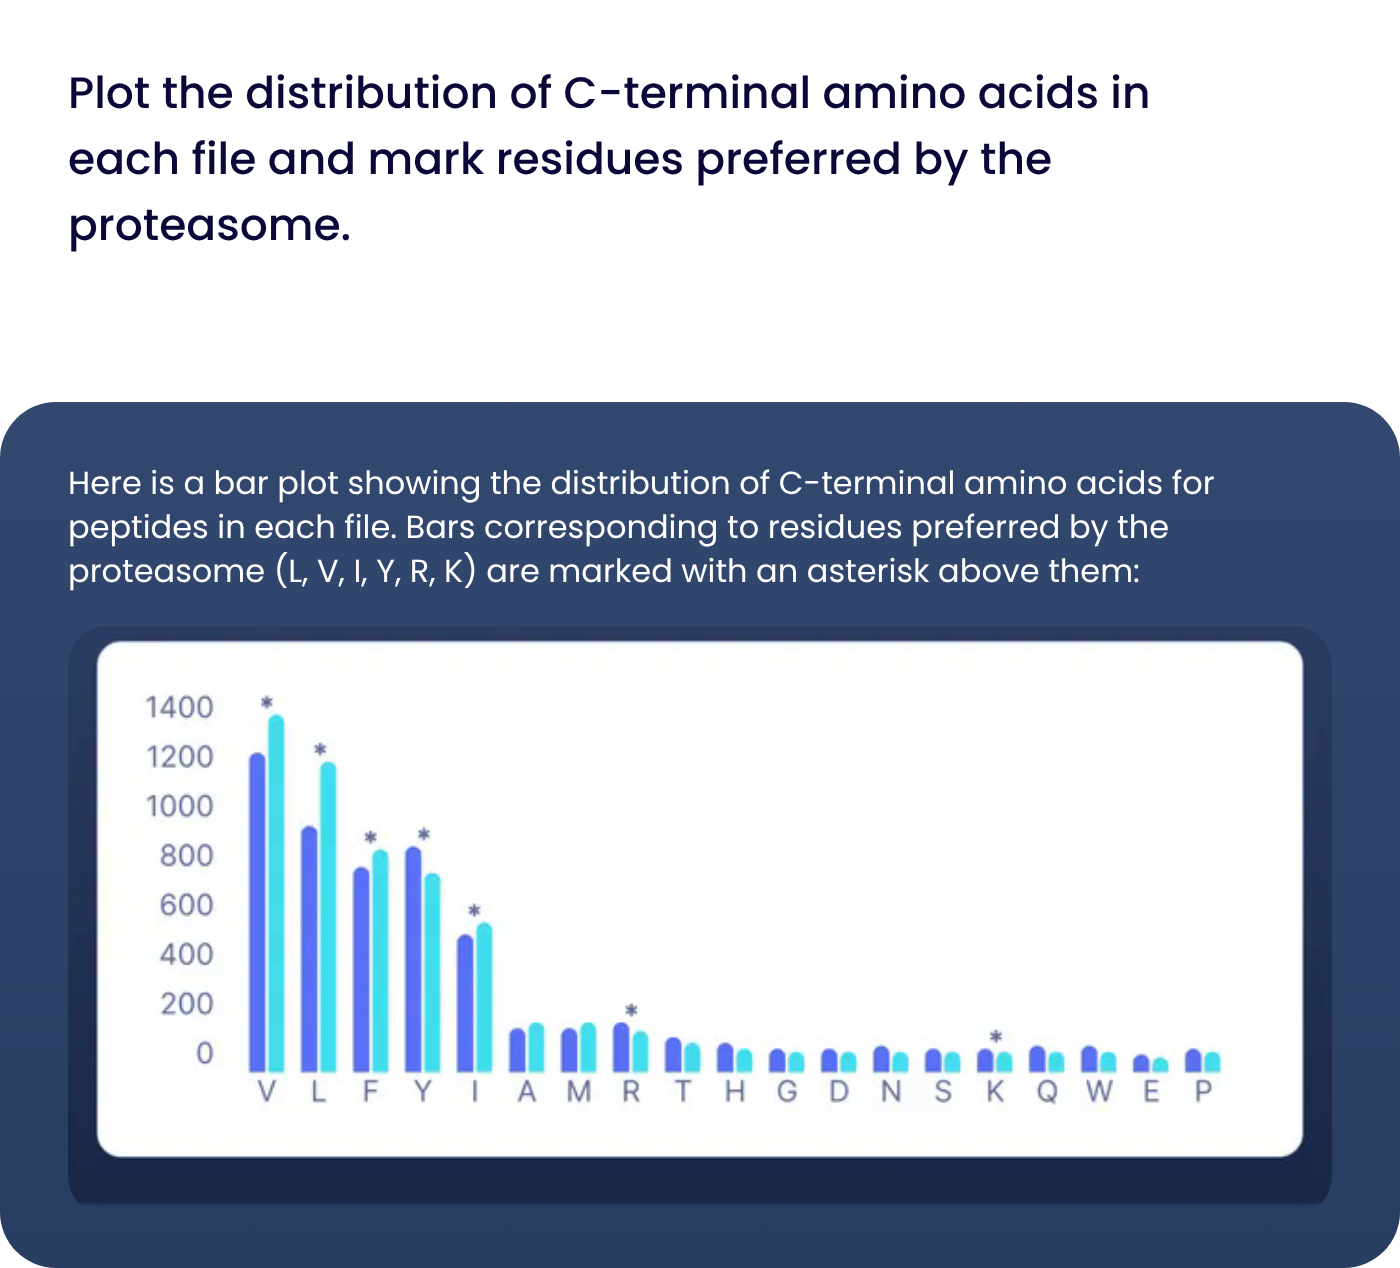
No scripting, no manual replotting. Describe what you want to see, and Chat generates it live from your dataset.
Highlight the top 20 most significant proteins in this comparison
Interactive Data Tables
No more coding required. Generate interactive, downloadable tables with a simple prompt.
Create a table showing the number of identified peptides and proteins and the identification rate for each file.
Protein & Peptide Interpretation
Ask about any protein or peptide of interest and get a synthesized answer, in context.
Tell me more about SDC1
Explains what a result means, not just what it is
Connects proteins and peptides to relevant biological context
Surfaces supporting literature when available
Cross-Dataset Comparison
Compare significant results across multiple datasets and see what holds up consistently.
Compare significant proteins across these three datasets and identify proteins with consistent increases or decreases.
Publication-Ready Graphs
Design custom charts and figures in minutes for papers, presentations, or collaboration.
Create a clustered heatmap of the top 8 differentially abundant proteins across 10 representative samples.

Start analyzing with Tesorai Chat
Ask questions, explore results, and move from data to insight in one conversation.